Light curve C: a raised cosine for the cloud-forest cabinet
An afternoon humidity creep on a clear May day pushed me to replace the cabinet's three-step LED schedule (40-60-40) with a smooth raised-cosine curve peaking at 70 % at solar noon. About 23 % more daily light, redistributed to keep the cabinet warmer through the late-afternoon RH danger window. Three-week experiment; this post will be updated 2026-05-25 with the result.
I noticed a slow afternoon humidity creep on the cabinet today. Target was at the 75 % floor (Colombian curve, clamped) and the cabinet was tracking it neatly through morning and noon — then around 15:00 the cabinet RH started rising again despite the PID having the outlet fans pinned at PWM 255. The “wait, what’s capping the fan?” hunt was a red herring: nothing was. The fans were at max. The PID was doing all it could.
The fix turned out to be upstream of the fans, in the LED schedule.
What was actually happening
Pulling the data for that window (13:00–17:00 CEST):
CEST    cabHumi%   cabT°C    Genoa room
14:30   79.82      21.95     22.96 / 56.7%
15:00   80.32      21.70     23.08 / 56.8%
15:30   81.49      21.44  ←  23.11 / 57.2%   cabinet COOLING
16:00   81.77      21.43     23.17 / 57.4%
16:30   81.88      21.47     23.26 / 57.4%
The cabinet cooled by 0.5 °C between 14:30 and 16:00, while the room kept warming. Plotting actual vapour pressure (Magnus formula) shows the absolute moisture was essentially flat — slowly decreasing, in fact. The fans were doing their job. The relative humidity rise was a thermodynamic artefact of falling temperature at near-constant water content.
So the next question is: why did the cabinet cool while the lights were still on?
The answer is in the LED schedule. The current schedule is a step function:
- 0 → 40 % over the dawn ramp (06:39 → 07:09)
- 40 % plateau through morning
- 40 → 60 % at “midday-up” (today: 11:44)
- 60 % plateau across solar noon (11:44 → 14:47)
- 60 → 40 % at “midday-down” (today: 14:47)
- 40 % plateau through afternoon
- 40 → 0 % at the dusk ramp (19:21 → 19:51)
Each step is a 30 min linear ramp; the plateaus are flat. The 60 % plateau lasts about 3 hours centred on solar noon. The moment it drops back to 40 %, LED heat input falls — and the cabinet starts cooling. That’s exactly what I saw at 14:47 today, with the RH following 30–60 minutes later as the temperature drop translated through Magnus.
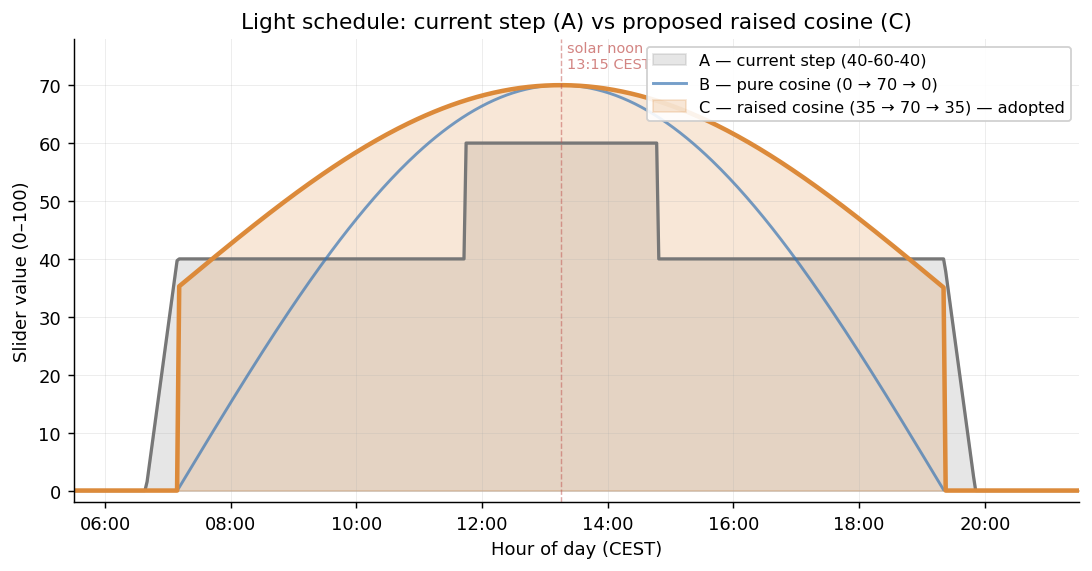
Cloud-forest light is not a step function
The natural sun curve at the equator is essentially a half-cosine: zero at sunrise, peak at solar noon, zero at sunset, with the steep zenith angles of low latitudes giving a sharp peak rather than a flat plateau. The cabinet’s plants are highland cloud forest specialists — Heliamphora from the tepuis, Dracula and Masdevallia from the Andes, Dendrobium cuthbertsonii from New Guinea highlands — habitats roughly between 1500–2500 m at low latitudes. None of these plants experience a flat midday plateau in their natural light environment. They get a sun curve that rises smoothly through morning, peaks above zenith, and decays smoothly through afternoon.
So both physiologically (smooth = natural, plateaus = artificial) and engineering-wise (plateau-then-drop creates the RH cliff I just observed), the step schedule is suboptimal.
Three candidate curves
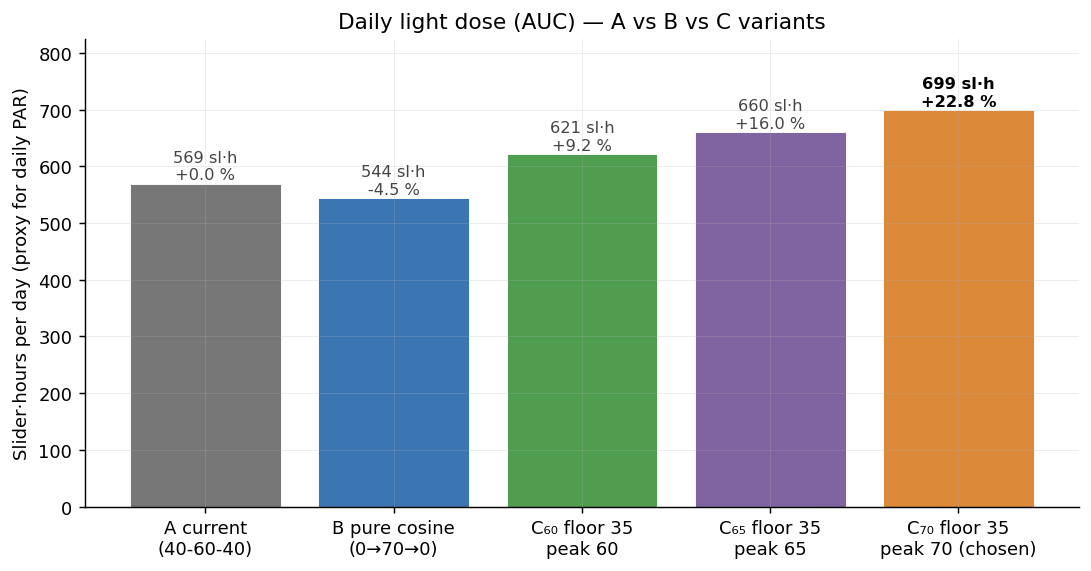
I evaluated three shapes:
| Curve | Shape | Peak | Min | Daily light dose (slider·h) | Δ vs current |
|---|---|---|---|---|---|
| A | step | 60 | 40 | 569 | baseline |
| B | pure cosine | 70 | 0 | 544 | −4.5 % |
| C₆₀ | raised cosine | 60 | 35 | 621 | +9 % |
| C₆₅ | raised cosine | 65 | 35 | 660 | +16 % |
| C₇₀ (adopted) | raised cosine | 70 | 35 | 699 | +23 % |
The +23 % figure looks alarming on paper, but the actual photon flux still sits well below tropical-noon irradiance — the cabinet’s Mean Well drivers have a hardware screw cap at roughly 60 % of rated current, so a slider value of 70 means roughly 70 % × 60 % = 42 % of the LED’s rated output. The plants receive a generous but not extreme dose, and the species in the cabinet (Heliamphora at the top under the brightest puck, Dracula and Masdevallia in the lower shade tier) tolerate considerably more than that in the wild.
I considered B (pure cosine) seriously because it is the most physically faithful shape, but the dim morning was a problem: at 09:00 it sits at slider 32, below the current plateau of 40, and the cabinet plants are clearly happier with at least a 40-baseline. So C — keeping the morning baseline at 35 (slightly below current, which I lowered intentionally to keep the AUC change reasonable) and rising smoothly to a 70 peak at noon — is the compromise that best fits both the engineering goal and the cloud-forest analogy.
Where the cabinet currently sits
For context, here’s the recent baseline from 21 days of telemetry:
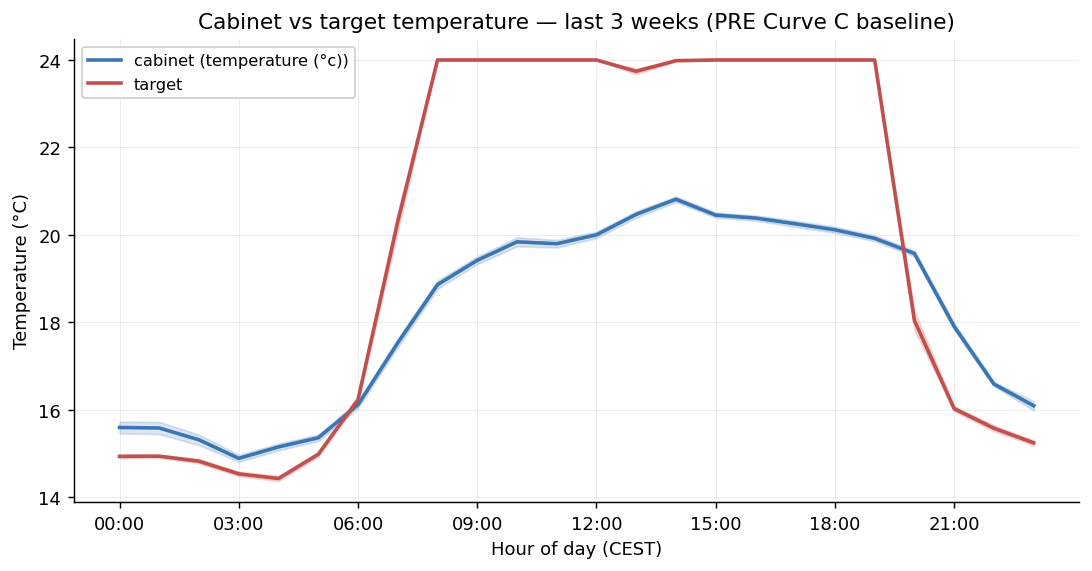
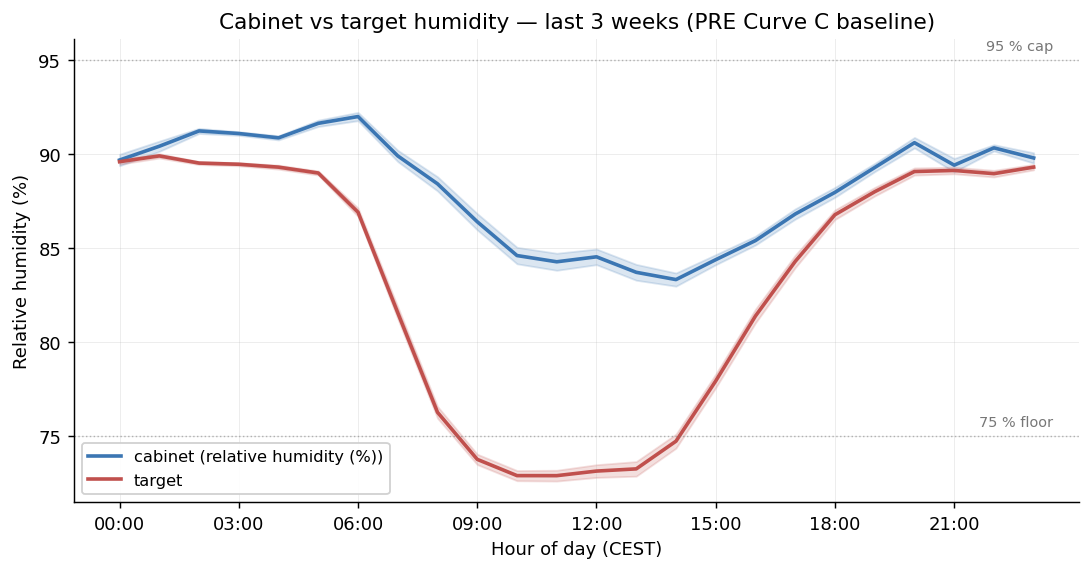
The interesting band on the humidity chart is 15:00–18:00 — the peak rises slightly above the 90 % line right when the LED step schedule has just dropped from 60 to 40. That is precisely the artefact the new curve is meant to fix.
What I implemented
A single function node on the Lights tab, fired by a 60-second interval inject (and once at NR start). It reads payload.photo_sunrise and payload.photo_sunset from the Photoperiod Calculator, then for the current minute computes:
slider(t) = max(35, 35 + 35 × cos(π × (t − solar_noon) / day_length))…and emits the inverted PWM value (255 → 0 mapping) to the existing pin8_writer_001, which handles serial output and door-safety override. The two old dynamic-dimmer nodes are disabled (not deleted — easy to revert). The Tapo on/off events at the photoperiod boundaries are unchanged: the smartplug still cycles power to the LED drivers on a daily schedule, the curve only handles the dim PWM signal within that on-window.
The whole change is one new function, one new inject, two disabled nodes, and a backup of flows.json for rollback. No new dependencies, no schema changes, no Grafana dashboard work.
What I expect to see
If the diagnosis is right, three things should change in the next 21 days of telemetry:
- The 15:00–18:00 humidity bump compresses. The cabinet should hold closer to target through the afternoon shoulder.
- Cabinet temperature stays slightly higher in the late afternoon (the LED is still feeding heat past the old midday-down moment).
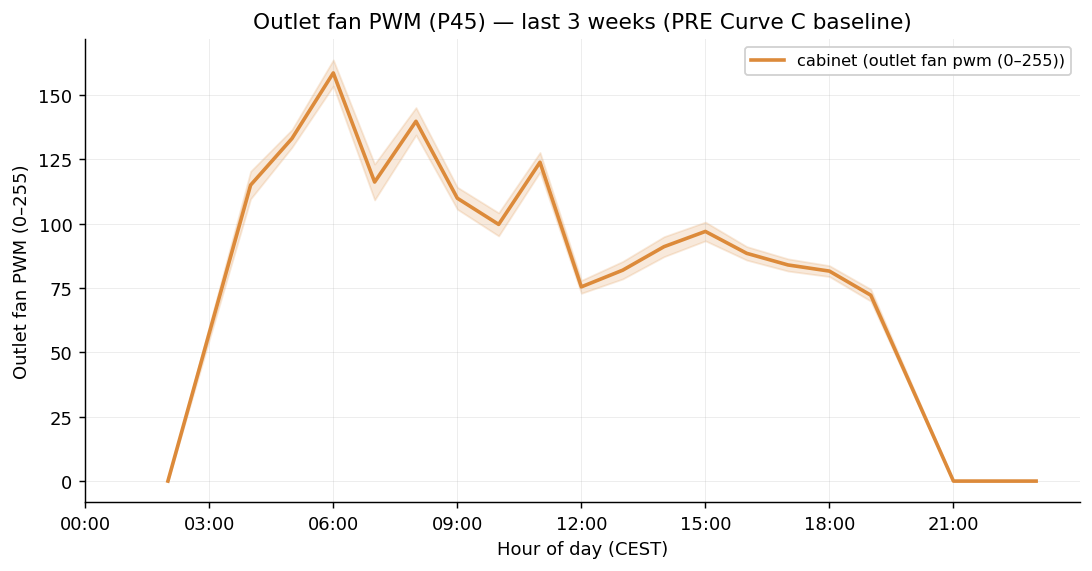
- Outlet fan PWM increases slightly during 14:00–17:00 because the PID has more thermal load to dump — but that’s a price worth paying to keep the RH from drifting up.
Things to watch out for that would mean the change was a mistake:
- Cabinet daytime temperature exceeds the 24 °C target more often. With +23 % daily light dose, the freezer might have to work harder, and on the warmest days the cabinet could exceed the daytime target. If
target_temperature_computedis regularly held below local temperature for >30 % of the daytime window, the peak is too high. - Lower-tier plants show light stress — bleaching on Dracula leaves, leaf curl on Masdevallia. The lower shade tier should be unaffected by the slider change (they live below the polycarbonate shelf), but a watch is in order.
- Driver running temperatures rise. The four Logic Puck V3 each have 140 mm pin heatsinks with 12 V fans; they’ve been comfortable at 60 % screw cap. A slider of 70 keeps them within the screw-cap headroom but they will run somewhat warmer.
Three weeks from today: what this post will look like
This is an experiment, not a finished change. On 2026-05-25 I will re-run the chart-generation script with three weeks of post-curve telemetry and update this post with:
- The same hour-of-day mean-and-CI plots, post-curve, side-by-side with the pre-curve baseline above.
- Whether the 15:00–18:00 RH bump compressed.
- Whether daytime cabinet temperature stayed within target.
- Whether anything ugly showed up in the plants.
If the answer is broadly “yes, it works”, the curve stays. If not, I’ll either drop the peak (try C₆₅), tweak the floor, or fall back to the step schedule with a wider 60 % plateau.
The data needed to make that call already exists in InfluxDB; the script lives at ~/terrarium-analysis/light_curve_charts.py on the Pi. The point of the post-by-post structure is to make the experiment legible — here is the hypothesis, here is the data, here is what I expect, here is what actually happened — rather than buried in commit messages.
See you in three weeks.
Day-1 update — 2026-05-05
A small interim update before the 2026-05-25 followup, because today is the first full day under Curve C and a few useful fixes happened along the way.
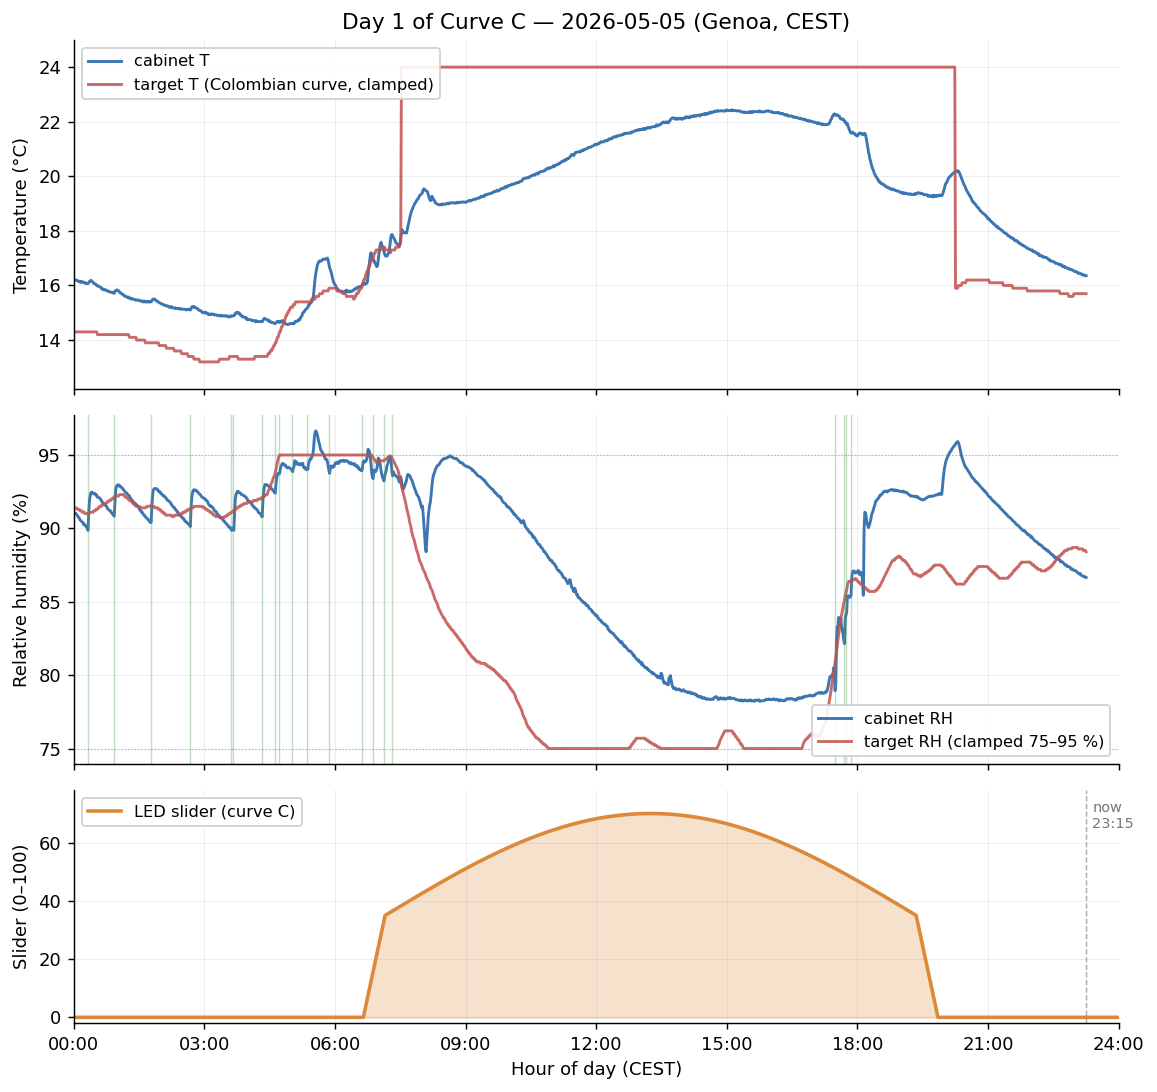
What today’s numbers say (00:00 → 13:53 CEST):
- Cabinet temperature: 14.6 °C overnight low → 22.4 °C peak. Mean 18.7 °C. The morning warming is steeper than under the old step schedule because the cosine drops less sharply onto a 35 % floor (vs the old 40 % plateau that landed earlier and held flat).
- Cabinet humidity: 78 % overnight low → 96.6 % peak. Mean 88.6 %. The cabinet entered the day drier than usual (warm previous afternoon left less buffered moisture), and the PID misted 20 times to track target.
- Slider trajectory (computed, since the global isn’t logged): 0 at 06:39 → 35 at 07:09 → climbs the cosine → 70.0 at 13:15 → 69.6 now.
A few small improvements landed today, in order of how much they matter:
Dawn and dusk soft-ramps restored. The original Curve C had a hard step from 0 (Tapo off) to 35 (FLOOR) at sunrise, and the same in reverse at sunset. Highland plants and Mean Well drivers both prefer to be eased in. The function now linearly ramps 0 → 35 over the 30 min before sunrise, then the cosine takes over — and symmetrically 35 → 0 over the 30 min after sunset. The transition is continuous: at sunrise the cosine output equals 35 (where cos(–π/2) = 0), so the dawn ramp meets the cosine seamlessly. Same in reverse at sunset.
Dashboard tracks the live curve. Until today the dashboard’s “Intensity of light” slider widget was being driven by an old startup-brightness function still using the 40-60-40 step schedule, so the UI showed e.g. 40 while the underlying PWM was at 70. The widget is now wired to the curve function’s second output and updates every 60 seconds; the AU gauge tracks too.
LED dim-signal watchdog. A separate change pushed yesterday: a function node monitors total power (Meross MSS310 on the same circuit as the LED drivers and freezer) and trips the lights’ Tapo plug if the LED drivers misbehave (dim PWM line floats → drivers go to full output). The model is expected = 32 W base + 2.8 × slider + (170 W if freezer on); trip at expected + 60 W. Calibrated empirically — yesterday’s accidental fault state was 311 W ≈ 280 W LED cap + 30 W base, so the screw cap is delivering ~70 % of rated, not 60 % as I’d assumed initially. False-tripped once this morning at 167 W under the wrong constants; fixed.
Mist tuning, derived from 21 days of mist-event data
The cooling miss on the 04 → 05 night surfaced a chronic pattern: the cabinet was being misted ~17–22 times per night, each event landing the RH a little above target, then drifting back, then re-firing. A textbook hunting loop. Adding latent heat each cycle made the freezer’s job harder.
I pulled 21 days of mist_event timestamps and stratified by simultaneous state, computing per-event ΔRH = peak[+30…+180 s] − baseline[−60…0 s]:
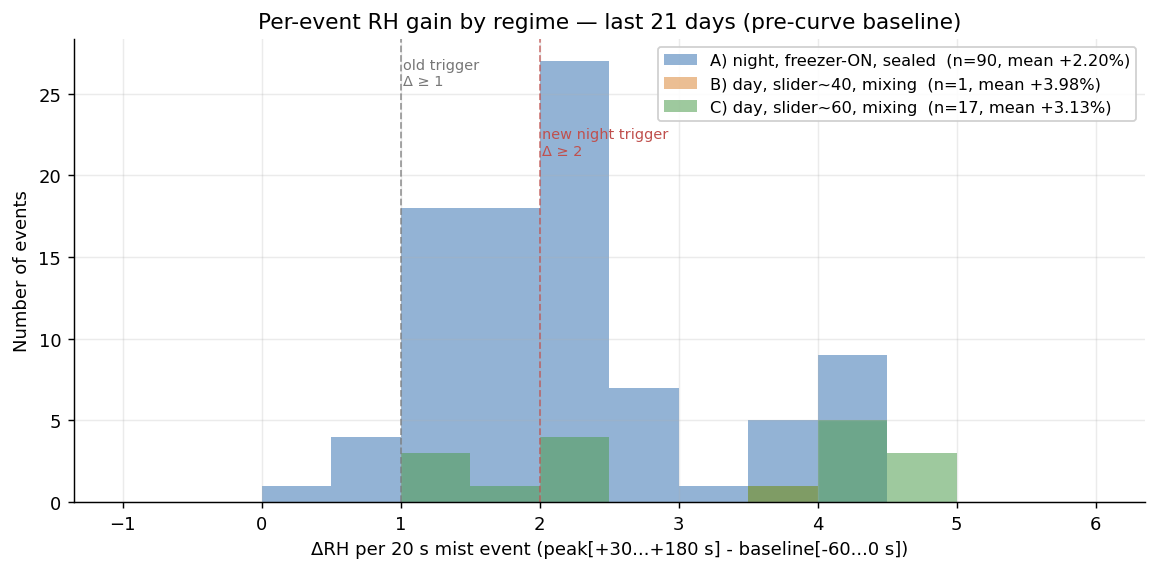
| stratum | n | room state | mean Δ | mechanism |
|---|---|---|---|---|
| Night, freezer-ON, outlet+impeller off | 96 | T 22 °C, RH 60 % | +2.1 % | sealed cabinet — vapor stays put but fights evaporator condensation |
| Day, freezer-OFF, slider ≈ 40, fans on | ~10 | T 23 °C, RH 47 % | +4.0 % | mixing with drier room — vapor easily replaces leaked air |
| Day, freezer-OFF, slider ≈ 60, fans on | 17 | T 22 °C, RH 49 % | +3.1 % | same mixing regime, more LED-driven fan activity |
Two regimes, two mechanisms, two different per-event gains. Treating both with a single fixed rule guarantees overshoot in at least one of them. The pre-tuning rule fired whenever the cabinet was 1 % below target and ran a 20 s mist regardless of regime — and 20 s of atomization is a +2 % gain at night, +3-4 % during day, so cabinet always landed above target on each event and re-triggered shortly after.
So as of today the humidity-driven mister trigger is regime-aware, gated on wbt_shutdown_active (the lights-off / cabinet-sealed window):
wbt_shutdown_active == 1 (night, sealed):  fire at  Δ ≥ 2,  20 s mist on-time
wbt_shutdown_active == 0 (day, mixing):    fire at  Δ ≥ 1,  10 s mist on-time
Threshold now matches gain in both regimes. At night the cabinet drifts down ~2 % between events, the trigger fires, and the +2 % mist lands the RH right at target — no overshoot, no immediate re-trigger. Daytime keeps the same trigger frequency but halves the per-event water + latent heat injection, since each daytime event was overshooting by 2–3 % anyway.
A methodological caveat I owe the data: my first instinct was to “regression-adjust” the daytime strata to a common room state and conclude the per-event gain was secretly the same (~+2.3 %) in all three regimes. That would have justified a single uniform tuning. But adjusting B and C to a 58 % RH room they never actually operate in (they live at 47–49 %) is extrapolation, not interpretation — the underlying physics genuinely differ between sealed and mixing regimes. The honest number is the per-stratum raw mean in each stratum’s own room conditions, and those are different. Hence two rules.
Expected effect on a clear-night cooling fight: half the events × similar latent kJ per event ≈ ~13 W less average heat injection during the freezer’s hardest 9-hour window. Not enough on its own to fix the dead P44 evaporator fan that triggered the 04→05 night undershoot, but it’s a free improvement and removes one of the two superimposed loads on the freezer.
What I’m watching now
- The 15:00–18:00 RH bump that triggered Curve C in the first place — the next three weeks will show whether the smooth afternoon shoulder closes that gap.
- Whether the cabinet’s daytime peak temperature creeps above target. Today it touched 22.4 °C around midday — well within the 24 °C target — but with one fewer evaporator fan and seasonally warming Genoa, this is the system-side metric to keep an eye on.
- Plant-side: I don’t expect to see anything on a 1-day timescale, but at the 2026-05-25 followup I’ll inspect the upper tier (Heliamphora, highland Nepenthes) for any photoinhibition tinging or pitcher abortion, and the lower-tier orchids for any leaf-tip burn.
The full post-curve hour-of-day assessment runs at 2026-05-25 as planned.
Followup — 2026-05-25 (T+21 days)
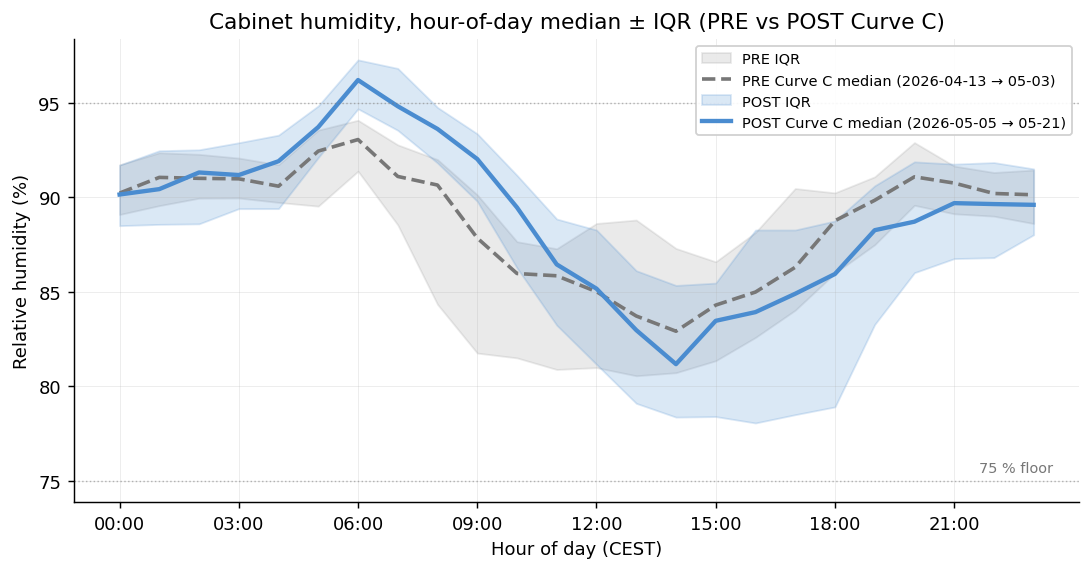
Three weeks in. Genoa stepped from spring to summer abruptly on 2026-05-22 (room mean +2.7 °C overnight, every day since pushing further). To keep the PRE/POST comparison season-controlled, the followup window stops on 2026-05-21 — leaving 17 post-curve days of pre-summer data against 21 pre-curve baseline days.
- PRE Curve C: 2026-04-13 → 2026-05-03 (21 days)
- POST Curve C: 2026-05-05 → 2026-05-21 (17 days)
- 2026-05-04 excluded as deployment day, 05-22 onward excluded as summer regime.
Descriptives — median + IQR
Means and standard deviations would be the wrong summary here. The afternoon RH distribution has long upper tails (sealed-cabinet morning highs spilling into the afternoon bins) and the POST window picks up wider day-to-day variability as Genoa drifts upward. Medians + IQRs are cleaner.
| Metric (15:00–18:00 CEST) | PRE Curve C | POST Curve C | Δ median |
|---|---|---|---|
| Cabinet RH | 84.90 % [IQR 82.67 – 88.52] | 83.55 % [IQR 78.30 – 88.27] | −1.36 pp |
| Cabinet temp | 20.25 °C [19.71 – 21.18] | 21.45 °C [20.26 – 22.24] | +1.20 °C |
| Outlet fan PWM | 66 [56 – 98] | 110 [85.5 – 213] | +44 |
| Mist events / day | 8 [IQR 0 – 12] | 10 [IQR 5 – 14] | +2 |
POST RH IQR widens at the bottom — the lower quartile drops from 82.67 % to 78.30 %. The PID is now running the outlet fans hard enough to occasionally push the cabinet a few percent below the median, but no individual 5-min sample below the 75 % floor in this dataset, so the floor clamp never engaged.
The headline picture
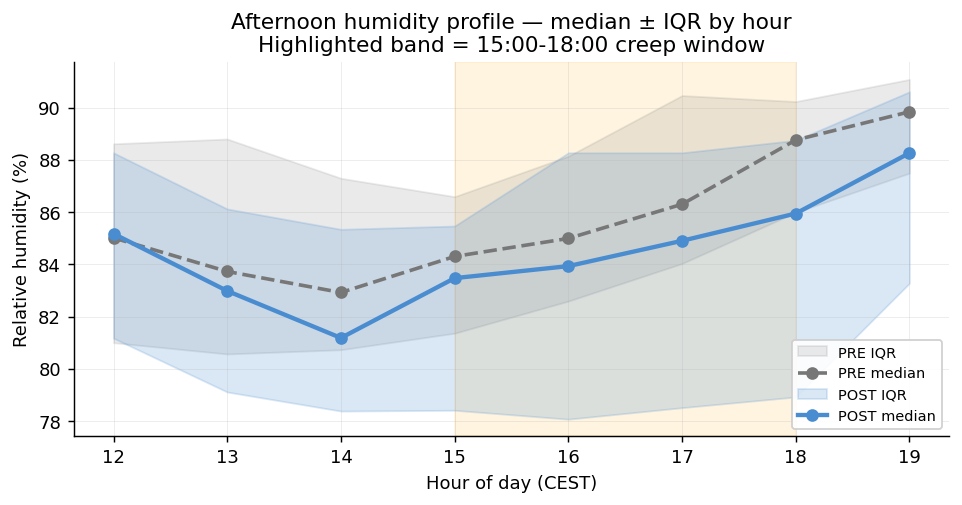
The afternoon climb from ~14:00 onward is the original creep that prompted the redesign. PRE climbs from ~83 % at 14:00 to ~88-89 % at 18-19. POST climbs from ~81 % to ~86 %, on a similar slope but starting lower and ending lower. The IQR bands tell the rest of the story: POST runs noticeably wider, especially below the median — the curve generates enough LED heat that the PID-driven outlet exchange occasionally drives the cabinet drier than typical, on the days the room can absorb the moisture.
Zooming out to the full day:
Was the room warming during the POST window?
Yes. Genoa was unusually cool through April and slowly warmed through May. By the second half of the POST window, room WBT averaged ~1 °C warmer than during the PRE window. Because the cabinet is air-coupled to the room through the outlet+impeller fans, warmer room WBT pushes cabinet RH up. So the curve was simultaneously fighting two things: the afternoon creep it was designed to fix, and a slow ambient warming pushing in the opposite direction.
To isolate the curve’s contribution, I regression-adjusted for room WBT.
Unadjusted vs WBT-adjusted regression
OLS on 5-minute observations within the 15:00–18:00 window, cluster-robust standard errors by day (samples within a day share weather noise):
| Model | POST coefficient | room covariate(s) | R² |
|---|---|---|---|
Unadjusted: cabinet_RH ~ POST | −4.40 pp [95 % CI −7.64, −1.17], p = 0.008 | — | 0.21 |
Adjusted: cabinet_RH ~ POST + room_WBT | −4.08 pp [95 % CI −6.71, −1.45], p = 0.002 | room_WBT: +2.33 pp/°C (p < 10⁻⁵) | 0.42 |
Saturated: cabinet_RH ~ POST + room_T + room_RH | −4.15 pp [−7.86, −0.45], p = 0.028 | room_T n.s.; room_RH: +0.34 pp/% (p < 10⁻⁸) | 0.42 |
Three things worth saying:
1. The unadjusted and WBT-adjusted POST coefficients are close (−4.40 vs −4.08). The room warming explains a small portion of the unadjusted delta but not most of it. The curve genuinely pushed afternoon cabinet RH down ~4 pp at the mean.
2. The OLS-mean delta (~−4 pp) is much larger than the marginal-median delta (−1.36 pp). Means are sensitive to upper-tail RH spikes; the curve appears to have flattened those more aggressively than it shifted the central tendency. Both numbers are honest descriptions of different aspects of the same effect.
3. Saturated model reveals: room dry-bulb temperature does not independently predict cabinet RH once room RH is controlled. The cabinet’s RH at any moment is, on the ambient side, driven by room humidity — not by room heat. Physically: it’s the moisture inflow from impeller-driven air exchange that matters, and at this temperature range absolute moisture goes with RH, not T.
Room humidity as the dominant ambient driver
That last finding is the result I hadn’t expected. The cabinet is less thermally isolated from Genoa than I’d implicitly assumed when picking peak heights — what the cabinet “feels” from the room is mostly the room’s water vapor content. Per +1 percentage point of room RH, cabinet RH at the same moment is +0.34 pp higher. Over a typical summer-vs-winter swing of, say, 20 pp room RH, that’s ~7 pp on the cabinet — bigger than the curve’s effect.
Practical implication: the seasonal Genoa indoor humidity cycle will move the cabinet more than the LED-heat lever can compensate for, in either direction. The curve is a useful tool to flatten the afternoon shape, but bulk humidity tracking is dominated by ambient. Worth remembering when next tempted to tune the curve further.
Verdict
Three converging pieces of evidence:
- Raw descriptive (median): afternoon RH ~1.4 pp lower, IQR wider at the bottom, the creep is still there but starts and ends lower.
- OLS, WBT-adjusted (mean): the curve’s pure effect on afternoon cabinet RH is −4.08 pp (95 % CI [−6.71, −1.45], p = 0.002), with cluster-robust SE accounting for within-day autocorrelation.
- Cabinet temperature: +1.20 °C median in the afternoon, comfortably within the 24 °C target ceiling — the T-PID has not had to engage during daytime.
The experiment did what it was supposed to do, and the regression analysis revealed something extra: room humidity is the largest single ambient predictor of cabinet humidity. The cabinet’s air-coupling to Genoa via the impeller/outlet fans dominates the LED heat lever for bulk humidity tracking.
What’s next
- Summer-onset window (2026-05-22 onward): not analyzed here on purpose. Will revisit in 4–6 weeks when there’s a clean summer-regime sample. Expecting the cabinet to track Genoa upward, and the freezer to engage during daytime — the regime the May 2026 PID and outlet-cap design changes were preemptively built for.
- Plant tier check at 2026-06-15 (six-week mark): upper-tier Heliamphora and Nepenthes for photoinhibition; lower-tier orchids for leaf-tip burn. No symptoms at three weeks.
- Mist count delta isn’t cleanly attributable. The regime-aware mist tuning landed the same week as Curve C, so the +2 events/day median could be either. Need a longer baseline of post-tuning, post-curve days to disentangle.
Analysis script (with the WBT-adjusted regression): ~/terrarium-analysis/light_curve_followup_3w.py. Raw data via InfluxDB highland.
Comments
Thoughts, corrections, trade offers welcome. Comments live on GitHub Discussions; sign in with a GitHub account to post.